Showing posts with label suricata. Show all posts

Tuesday, June 28, 2022

Suricata: DataSets for IOCs

 After reviewing MalTrail, I wanted to see if there were other ways to provide the same/close to the same type of information based on software I was already using.  This led me to Suricata and IPREP, and DATASETS.  

While reading up, I found an article over at IDSTower about Datasets, and figured this would be a good starting point for comparing the two applications.   

The article was setting up Datasets for bad domains, and  based on the instructions it would be an easy add to Security Onion without having to really mess with any of the Salt files (I believe IPREP I will have to make some changes to Salt files, but that will be another article.)

Overall the process was pretty simple, I did change one thing, instead of adding iocs.rules, I added my rule to local.rules, and ran so-rule-update.   I believe to add the iocs.rules as a separate source I will have to edit the Salt file for the IDSTools Docker. 

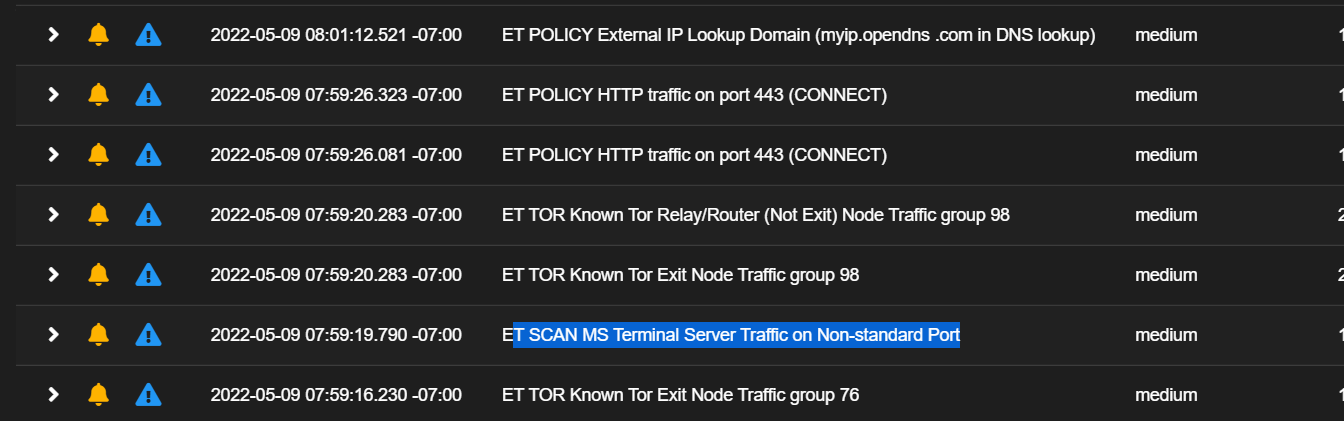
After I had set up the new rule, I did a nslookup to a bad site:  (From the Alerts Pane).  


I think I will have to make a custom alert to see more information on these, or maybe a dashboard might work.  

I would like to see the name of the bad IP/DNS entry, and possibly the country/region for the IP/DNS for a quick alert view pane.  

Now MalTrail looks like:  (screen capture taken from their Demo)


I would think to get the "info" section I would need to break out the DataSets per type of IOC as the Alert Description, the other ones are pretty standard fields I could pull.

Next, I think I will try and pull the MalTrail data into Logstash in SecurityOnion, think I read somewher e there is a Logstash setting in MalTrail, or it should be pretty easy to use the data file created from MalTrail to ingest into Logstash.  


Monday, June 20, 2022

SecurityOnion@Home - Alerts

 It's been a bit of time with my SecurityOnion server monitoring my network (out-of-band) and wanted to do an update on the type of alerts that I am seeing, and at least try to identify what some of them might be.

Below is a screen shot of some of the alerts.  I also noticed that I am having issues Pivoting to PCAP inside SecurityOnion right now, not sure if it is something I possibly did, or just something with the .130 update (I have not done PCAP since the upgrade)   


 1.  GPL WEB_SERVER:  This looks like my Lenovo Smart Hub is trying to talk to something else on my network (Which is currently not on since I use DHCP, might switch them all to static for better tracking).  But it looks like to trying to talk to these other devices about youtube.

2.  I pay for Spotify for the family, so not really going to delve to deep on this one.

3.  The next 2x are discord which I know is in use also

4.  .cloud - Family is mostly Apple, and a quick look they are all the apple devices.

5.  Microsoft Update - Validated

6.  ET-DNS as Non-Compliant DNS traffic -  Well this is my new cell phone, unsure what is doing.

7.  DNS Query TOR Hidden (.onion) - Also my cell phone.  

***Cell phone is Samsung 22 Ultra (Unlocked) on Tmobile.   I will have to do some more research on these two to see what the phone is doing.  


Tuesday, May 24, 2022

SecurityOnion@Home - Suricata Include

 At work we started to use the include statement in our Suricata.yaml file while we were using SecurityOnion 16.04 and with the switch to SecurityOnion 2.3, I wanted to see how easy this would be to implement.  

First things first, we go from having a Suricata.yaml for each interface to having one bonded interface, so that makes updating simple.  With the bonded interface there is no more /etc/nsm/interface/suricata.yaml. I did find a suricata.yaml file under /opt/so/conf/suricata/ but it's created and managed with Salt, which means I probably cannot/should not edit that file directly. 

I am running a standalone version of SecurityOnion at my house so the steps might be a little different in a distributed environment.   

In the salt configuration first place I found a reference to the suricata yaml file was at:

/opt/so/saltstack/default/salt/suricata/default.yaml  which build out the suricata.yaml to /opt/so/conf/suricata.  

I decided to put the test_var.yaml @ /opt/so/conf/suricata/ 

Lets see what happens when I add the include file directly to the default.yaml file.  

  1. After the update you run:  salt minionname_standalone state.highstate
  2. Run:  so-status 

             3. Run: so-suricata-start
     4. Run: docker logs so-suricata


 It's looking for the file in the /etc/suricata/ folder (Which does not exist on-base OS, but it does exist on the Docker container for Suricata.  

We can validate this with docker inspect so-suricata (Looking for Binds)


As you can see that there is a /etc/suricata (The right side of the bind, which is the Docker container).  Looks like for the most part there are files that are bound between the Docker image and the core OS of SecurityOnion. 

I thought about putting the include file on the docker file @ /etc/suricata, but this does not sound like a good option for two reasons:

  1. Upgrades would erase this
  2. Probably more important, unsure if the included file inside the docker would work due to connecting the core OS.  

 From the last image it looks like I could potentially put the file in two directory locations:

  1.  /nsm/suricata ---> This is where the eve.json files are, so probably not the best location
  2.  /opt/so/conf/suricata/rules -->  which maps to /etc/suricata/rules on the docker container
Back to salt to make some updates to the sls files.   I am editing the /opt/so/saltstack/local/pillars/minions/name_standalone.sls
Note: Remember spacing (2) on yaml files
  1. Edit the sls at the end:
            suricata:
              config:
                include:/etc/suricata/rules/test_var.yaml
  1. Next I copy the test_var.yaml -> /opt/so/conf/suricata/rules
  2. Then I run: salt minionname_standalone state.highstate
  3. Check Docker containers with so-status (All good)
  4. And validate with docker logs so-suricata

Now I have an include file as part of SecurityOnion, and my local teams can update that file which could cause Suricata to fail, but it's better than them trying to update the sls files under minions to add/remove variables in my opinion (which could break more functionality besides Suricata)


Monday, May 9, 2022

SecurityOnion@Home: Alerts Day 1

 After a few reloads I have SecurityOnion 2.3 on my home network.  I have set up a TAP between my Netgear Mesh MR60 and the TP-LINK SG108 Switch.  90% of my traffic is WiFi, with only a few dedicated hard-wired machines.  

Hardwired machines:  My desktop, My Work Computer, Phillips Hue, and backhaul for one of the MS60 (Netgear Mesh).

Wifi: Everything else (TVs, Garage Door, Roku's, Apple TV, Phones (a lot), Tablets, 4x Laptops)

Currently, I am wondering if I should move the TAP from between the LAN/Switch, to the WAN/Modem side.  From there I could possibly create a spanning port on the switch (Which is getting replaced soon with Zyxel GS1100 16) for the rest of the traffic.

Below is my current alerts (I cut off the IPs).    

The first alert I noticed (not in the image) was:

ET POLICY Incoming Basic Auth Base64 HTTP Password detected unencrypted. (IP was my router).  

            * This was because my web access to the router was set at HTTP only, not HTTPS.   

The next batch of alerts are below: 

1.  ET POLICY External Lookup Domain (myip.opendns)  - I use OpenDns for my kids laptops for a some blocking. 

2.  ET POLICY HTTP Traffic on port 443 (This looks like it going to Amazon)  - Identified.

3.  ET TOR Know TOR relay/Router (Not Exit)/Exit Node Group 98 -  Plex Server using the Remote Access Port identified in Settings
        * Read that this could be NTP related, need to identify what it does

4.  ET SCAN MS Terminal Server Traffic on Non-Standard Port  - Plex Server using the Remote Access Port identified in Settings

5.  ET TOR Known TOR exit Node Traffic group 76 - Plex Server using the Remote Access Port identified in Settings


I think I was expecting more alerts on my network, but it could be just the TAP placement.  


Sunday, May 8, 2022

Home Setup - Initial

 I have been using all these sites (TryHackMe, BlueLabsOnline, HacktheBox) to try and learn but I think the best way to get some knowledge is to monitor my own internet and see what kind of alerts I am getting and research them.   The other day I purchased a new switch (16 ports) up from the 8 port switch that I currently use.   Really I only needed like 10 ports but it was hard to find a 10 or 12-port switch.  The Zyxel GS-1100 16 switch I purchased was used (40$ vice MSRP of about 100$).  

I figured I could use it to create a spanning port for now, or try and acquire a cheap TAP (whereas I would not need the extra ports).     In the TAP scenario, I figure the best place to TAP would be between the router and the modem.  For spanning, I would span port 1 (the one coming from the router). 

I already have an extra NIC in my main computer, and planning on building a new SecurityOnion 2.3 VM to start with.  I thought of SecurityOnion 16.04, but believe it's better to go newer. I might also build a few other VMs.  Currently thinking also of building a Splunk VM, but curious to think of what other VMs for monitoring traffic might be best.  

I have seen other systems like OpenNSM, and DynamiteNSM, or I could try and roll something myself.  That could be interesting, not sure I know what I would be doing or what I would want in the system.


Wednesday, April 27, 2022

SecurityOnion 16.04 - Squild

  Interesting issue arose today while trying to validate an installation of SecurityOnion 16.04.  I was not seeing any traffic except SURICATA rules (even though ET PRO is installed).  I decided to make my own rule in local.rules.  

Get ready for some fun here, cause about 6Gb of ingest and I decided to write this without thinking:

alert any any -> any any (msg:"TEST TEST"; flow:established; classtype:misc_attack; sid:"999999"; rev:1;)

Then I ran sudo rule-update

Not starting that any any will just about kill the system as it alerts everything, but I also think the SID number was too low to use, which might have caused other issues.  

Five minutes into it and I am seeing in Squert 1K alert, 10 minutes I am at 40K alerts, but interesting enough some ET PRO rules also are now firing.     I removed the local.rules alert, reran sudo rule-update (no more TEST rules). 

TEST Alert is now showing 150K in Squert.  

Here are the commands I typed (From Suricata gone wild)

  1. sudo so-sguild-stop
  2. sudo mysql --defaults-file=/etc/mysql/debian.cnf -Dsecurityonion_db
  3. SELECT COUNT(*) AS cnt, signature, signature_id FROM event WHERE status=0 GROUP BY signature ORDER BY cnt DESC LIMIT 20;   (Top 20)

Interesting find here now under uncategorized events : 

TEST Rule 150K    999999

Snort Alert [1:999999:1]  999999

So I have two alerts now for the same issues (This is because mid-stream I removed the TEST rule from my local.rules which deleted it out of my download.rules

  1. UPDATE event SET status=1, WHERE event.status=0 and event.signature LIKE 'TEST%';
  2. exit
  3. sudo so-squid-start

This cleaned up the TEST alert, but I still had the Snort Alert. I wanted to wait for full processing then delete the Snort Alert to see if it came back

About an hour later I validated that traffic was done processing and that Snort Alert was still there.

  1. sudo so-sguild-stop
  2. sudo mysql --defaults-file=/etc/mysql/debian.cnf -Dsecurityonion_db
  3. UPDATE event SET status=1, WHERE event.status=0 and event.signature_id='999999';
  4. exit
  5. sudo so-squid-start
My system was now clean from the ghost SID.  

Monday, April 11, 2022

Udemy: Snort Intrusion Detection

The other day I started a Udemy course: Snort Intrustion Detection, Rule Writing, and PCAP Analysis. In the lesson they use VirtualBox, I chose to use VMware, as that is what I have installed currently on my machine. Second was that a few of the sections were about setting up SecurityOnion and Kali (Both of which I already have active VMs for). That enabled me to shave off some of the time running through the training as they were setup as vanilla load, the only exception is that I have been using Suricata vice Snort, but for the most part I did not have an issue. One of the first rules was about SPAM, which we created a basic rule, and then added offset, and depth which he was able to explain. Suricata did not like the depth talked about in the video, stating it was shorter then the content (+1) to that number, and seemed to work with no ill effect. I need to read up more about offset/depth with reguards to Suricata, and see if it was just something I was doing wrong, or if there is a true differance between Snort and Suricata. Following that we did some other rules, and validated rules against VMs with known vulernabilities. I think this course helped a bit in understanding how the rulesets work, and will help with my current job.

Sunday, April 28, 2019

Index or Lookup Emerging Threats or AlienVault OTX

Currently I have my Emerging Threats being run through Suricata, and the OTX being run through Zeek on my SecurityOnion which then feeds to my Splunk instance.  I seem to have already broken my Kibana (will have to research that next - side panels run, but its all white space where the actual data should be). 

After reading a few articles: 
Malware Analysis
IDS alert challenge
Splunk Enterprise Security
IDS rules for PulledPork

Now I know that SecurityOnion uses pulledpork currently for its rule management, but I believe in future versions it will be moving to Suricata-update (well at least for Suricata).  But that does not matter currently. 

Emerging Threats updates a file called downloaded.rules, and OTX created a file called otx.dat, these both hold the rules which can be either parsed into an index or TSV/CSV out into a lookup table. 

Currently, I am trying to decide which way would be the most beneficial to most me, and other users of my system. 

I also think there is at least another file that goes with the Snort VRT which goes into further details based on the SID and is called the opensource.gz  For Emerging Threats it is called SID-Descriptions-ETOpen.json.gz which I think provides the same information for that rule set.

I am leaning towards putting the rules into an index, but I could be swayed either way, or to not even try this, but I think this has potential for analysts who try and hunt, to be able to look back at what signatures are hit on, and not have to Google every one of them.   

Wednesday, April 10, 2019

Suricata/Bro ingesting in Splunk

In these blog posts, I wish I was explaining how do some of these things, but currently, it's more of where I am at in the process as I learn more I will create instructional posts with images.  

So I have Zeek and Suricata data being ingested from my Security Onion VM.   I originally had the local.conf files for both something like this
[monitor:///nsm/bro/logs/....]
sourcetype:bro
index=bro

[monitor:///nsm/sensor-data/sensor/...]
sourcetype:suricata
index:suricata

But I thought it would be better to break out the sourcetypes based off the logs.  From what I am looking at SecurityOnion defaults to log files vice Json format for its log creation(correct me if I am wrong).  

So I set it up:
[monitor:///nsm/bro/logs/current/conn.log]
sourcetype:bro_conn
index=bro

[monitor:///nsm/bro/logs/current/dns.log]
sourcetype:bro_dns
index=bro

But the source types showing up in Splunk are (dns-4, tls-11, conn) so it looks like they are just random created, not using the TA's that I have installed for the most part (If anyone can assist that would be great).  

Reading over the Splunk documentation maybe it should be sourcetype:bro for all them, and it will append the _conn, _dns, ect.   

Still waiting to get the Suricata Emerging Threats to display on Splunk (maybe I am just lucky and I have no ET alerts) but I did add a second monitor of the suricata.log (where I noticed Kibana was pulling the alert information from).


Monday, April 8, 2019

Suricata.yaml in search of Alerts

I setup suricata.yaml to write create the EVE json file for Suricata, but I was still not receiving alerts through it on Splunk.  So tonight I took a second look at the Suricata.yaml and noticed it was referencing the suricata.log file further down the document.

For the meantime I have added a 3rd monitor for Suricata /var/log/nsm/sensor/suricata.log which should now allow the alerts to be ingested by Splunk.   I am currently in the process of restarting all instances of Splunk so we will see shortly.

Sunday, April 7, 2019

SecurityOnion with Splunk

Recently I installed SecurityOnion 16.04, and wanted to play with Splunk on top of SecurityOnion (I know it basically has Elastic with Kibana, but I just wanted to use a different tool at the same time. 

Setting up Splunk was pretty straight forward, installed it on a second VM running Ubuntu.  I then added the Splunk forwarder to SecurityOnion.  (7.2.5.1 for both).   Another pretty easy install.

Next, I downloaded the TA's (Technology Add-ons) from SplunkBase for Bro and Suricata.  Bro setup was easy, just setup Splunk to monitor the bro/current logs, and I was receiving data on Splunk.  Suricata was a little different, as I was only getting the Suricata stats. 

SecurityOnion uses separate log files, but I from what I understand (correct me if I am wrong) Splunk gets more details in the event data was something like the eve json that is possible with Suricata.  So with that, I decided to start up the eve json file (called it suricata.json).

I started to get the majority of my Suricata feeds into Splunk, currently only missing the actual alerts being fired.  I will need to go back and look at what is missing in either the monitoring or in the eve json file (suricata.yaml)

It is nice to be able to see the same data in two different SIEM type products, to have the ability to compare search queries and see different visualizations. 

Monday, March 11, 2019

Intel Threats ingesting into SecurityOnion

Earlier today I re-created my SecurityOnion VM, and turned on the port mirroring on my TP-LINK switch.  One thing I still need to figure out is if I need to mirror both ingress/egress on separate ports or is it a 1-for-1. 

I signed up for IBM X-Force Intel feeds, AlienVault OTX Threat Feeds, and Critical Threat feeds.  Currently, I only set up on the AlienVault OTX threats as I am not sure if I can have multiple threats loaded.  I think I can just have not had time to read through everything. 

I used the guide found at SecurityOnion OTX Intel Threat setup with Bro(Zeek). 

Overall the instructions provided by the SecurityOnion team were easy to follow and ran into no errors.  One thing I would have like but understand from a security point of view was the input of the API key.  It a blank field and no cursor movement to see if you have put in a specific number of characters.  I used cut/paste on my second attempt (first one I tried to hand copy from my main machine to the VM) 

Now to sit back and watch Bro and Suricata report back what's going on my network.  Next project will be adding a Splunk forwarder.  I know there is Kibana, but I would like to have the option for both. 

Can anyone think of any other type of files/feeds I should be ingesting in Bro/Suricata?   Or another application to run on SecurityOnion? 


Tuesday, March 5, 2019

SecurityOnion 16.04 up and running

I am still waiting on purchasing a new to me system for my security onion setup.  In the meantime I have added an additional NIC to my main computer and set up a SecurityOnion VM. 

The plan was to use the additional NIC to mirror the main ethernet cable from my router (EdgeRouter Lite) to the switch (TP LINK SG2008)

In the TP-LINK I setup port 1 Ingress/Egress to be mirrored to port 8 and ran a new ethernet cable from port 8 to the new NIC on the PC.    Next, I installed the SecurityOnion VM, and make all the necessary updates to the system.

Using the two NICs, one setup as management, and the second in promiscuous mode.   After this, I opened up Kibana to see the traffic.  On a side note, I have not used ELK stack often more used to Splunk but was able to get a general first impression.

One thing I noticed was my internet speeds also were drastically slower, but I think this was just timing and not directly related to the port mirroring.   I undid all my changes to my NIC card just in case, and tested speeds from my router (4mbs)  when I should be getting 150mbs per my internet provider. 

Later that evening, my speeds returned with no real changes by me.  So I will go back and re-setup the switch, and continue to ingest data.

Future plans:
Ingest IBM X-Force Intel Feeds
Ingest AlienVault OTX Intel Feeds
Setup Splunk forwarder
Install Splunk (new VM)
MITRE ATTA&K Framework